
Logstash vs. Fluentd, a drag race
8 October 2020
Dusty Lefevre

Logstash and Fluentd, both log aggregators, and largely interchangeable. But how do they compare when put under high load? How different are the resource requirements? Which one should you pick when you want to aggregate logs into an Elasticsearch cluster?
These are some questions that popped up while collaborating on a digital dashboard project at one of our clients at FlowFactor. At that time we didn’t perform any extensive comparisons. We kept all tools within the same family and set up a classic ELK stack with Logstash.
One thing that struck me was although there were plenty of articles comparing features, I could hardly find any data on the raw performance of both tools. Which led me to this brief experiment: a benchmark of both tools in an ELK and EFK stack.
I will focus on the behavior of both tools under high volumes.
Will they bend or break, and which one will cave first?
Benchmark setup
For this benchmark I’m mainly interested in how Logstash and Fluend react in comparable circumstances. I’ll be feeding both aggregators the same data and will ramp up volumes gradually.
The events are scraped from a Wildfly server log and enhanced with some details of the runtime environment. The server log will contain a variety of log messages and will yield events with an average size of 1.5 KiB. Ten dedicated worker nodes will generate these events.
Both aggregators implement comparable pipelines and forward the parsed events to an Elasticsearch cluster. The Elasticsearch cluster must not act as a bottleneck and is significantly oversized.
I will rely on off-the-shelf tools to monitor and plot the results of my benchmark. All these tools are conveniently bundled on a single Controller node.
- Ansible: provision and operate the setup.
- Kibana: plot graphs of the by Elasticsearch ingested events.
- Prometheus: monitor and aggregate node and JVM statistics.
- Grafana: plot graphs of node resource usage.
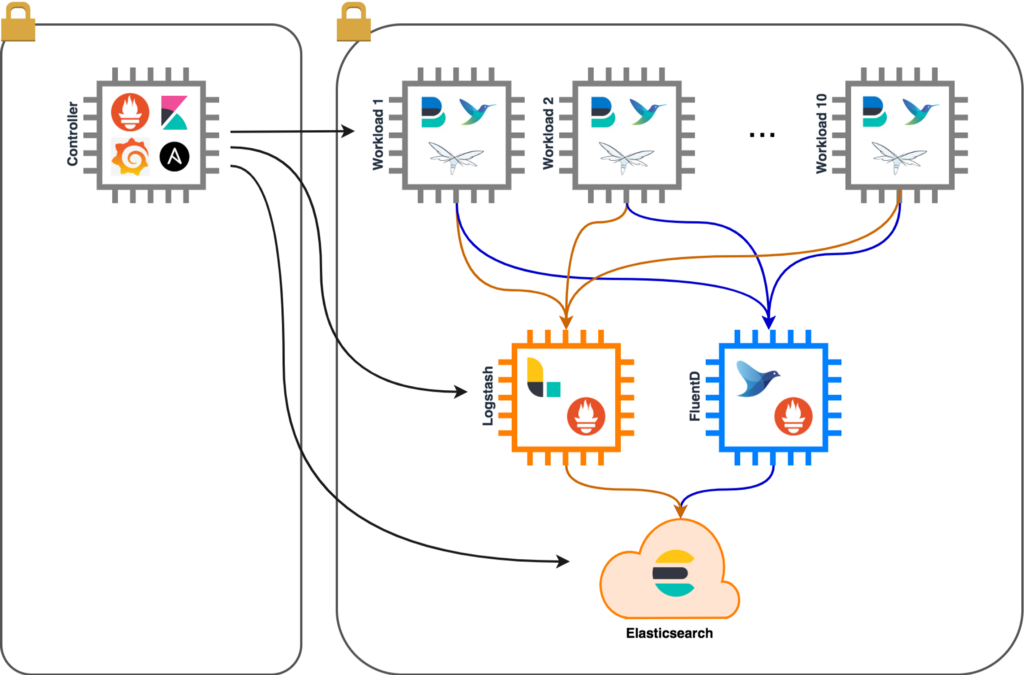
I collect metrics from all nodes but I’m mainly interested in the Logstash and Fluentd results. The other metrics are still useful to detect, for example, congestion on the workload nodes.
Workload nodes
The workload nodes produce a steady flow of events for Logstash and Fluend to process. There are 10 nodes in total, providing ample volume, with the following specs:
- CPU: 2 vCPU @ 3.6 GHz.
- Memory: 4 GiB
Events are generated by scraping a Wildfly server log. The Wildfly server contains a single web-service and writes several events to the server log for each call received. One in 10 calls results in an IndexOutOfBounds exception and writes a multi-line stack trace to the log.
A simple python script provides the necessary input. It can spawn an arbitrary amount of threads that send SOAP requests to the web-service. Each thread will send 10 requests/sec.
FileBeat
The FileBeat agent will scrape the Wildfly server log and combine multi-line log lines into a single event. To give the events sent to Logstash more body, I also add the add_host_metadata processor.
filebeat.inputs:
   - type: log
     enabled: true
     paths:
       - /opt/wildfly/standalone/log/server.log
     multiline:
       pattern: "^[0-9]{4}-[0-9]{2}-[0-9]{2} [0-9]{2}:[0-9]{2}:[0-9]{2},[0-9]{3}"
       negate: true
       match: after
     fields:
       source: wildfly
processors:
   - add_host_metadata: {}
...
The connection between FileBeat and Logstash is secured using Mutual TLS Authentication.
FluentBit
FluentBit proved to be more tricky. While it’s easy to configure FluentBit to scrape multi-line log entries, the events themselves were significantly smaller compared to the ones generated by FileBeat. Because of the nested nature of the extra fields that my Logstash configuration introduces, I will add a Lua filter to add a comparable set of fields.
function enhance_record(tag, timestamp, record)
     nrec = record
     nrec["agent"] = {
         hostname = "{{ ansible_host }}",
         name = "{{ inventory_hostname }}",
         type = "fluentbit",
         id = "{{ system_uuid }}",
         ephemeral_id_ = "{{ system_uuid }}",
         version = "unknown",
     }
     nrec["gol"] = {
         file = {
             path = "/opt/wildfly/standalone/log/server.log",
             offset = 0
         }
     }
     nrec["host"] = {
         hostname = "{{ ansible_host }}",
         name = "{{ inventory_hostname }}",
         mac = "{{ ansible_default_ipv4.macaddress}}",
         id = "{{ system_uuid }}",
         containerized = "false",
         ip = { "{{ ansible_default_ipv4.address }}", "{{ ansible_all_ipv6_addresses[0] }}" },
         os = {
             kernel = "{{ ansible_kernel }}",
             family = "{{ ansible_os_family }}",
             name = "Amazon Linux",
             version = 2,
             codename = "Karoo",
             platform = "amzn"
         },
         architecture = "{{ ansible_architecture }}"
     }
     nrec["fields"] = { source = "wildfly" }
     nrec["input"] = { type = "source"}
     return 1, timestamp, nrec
end
Successfully detecting new lines in the server log also requires a new parser:
[PARSER]
     Name wildfly_raw
     Format regex
     Regex ^(?<log>\d{4}-\d{2}-\d{2}\s+\d{2}:\d{2}:\d{2},\d{3}\s+.*)$Fluentd
The following configuration will now successfully scrape the server logs:
[INPUT]
     Name tail
     Path /opt/wildfly/standalone/log/server.log
     DB /var/tmp/tail.db
     Tag wildfly
     Multiline on
     Parser_Firstline wildfly_raw
[FILTER]
     Name lua
     Match *
     Script /etc/td-agent-bit/enhance.lua
     Call enhance_recordLogstash
...
The connection between FluentBit and Fluentd is secured using Mutual TLS Authentication.
Logstash
Logstash will not need a beast of a machine. After all, the better it performs, the more workload nodes I will need to bring it to its knees. I settled for:
- CPU: 2 vCPU @ 2.5 GHz.
- Memory: 2 GiB.
I set up Logstash to use OpenJDK 11 and mostly default settings. I leave the heap at 1 GiB and also use the ConcurrentMarkAndSweep garbage collector. Full Garbage Collection cycles will start when the Old generation reaches 75% occupancy. A fixed heap is a superb way to hide the memory impact of the application from the exported metrics. For this reason, I will also load the jmx_exporter agent and collect the exported metrics in Prometheus.
The point of entry for FileBeat will be the beats input plugin. SSL is enabled and Mutual TLS Authentication is enforced.
input {
     beats {
         port => 5044
         ssl => true
         ssl_key => "/etc/logstash/node-pkcs8.key"
         ssl_certificate => "/etc/logstash/node-fullchain.pem"
         ssl_certificate_authorities => "/etc/logstash/ca.pem"
         ssl_verify_mode => "force_peer"
     }
 }
The filter in the pipeline is simple. It will break each event, essentially a single entry in the Wildfly server log, into its relevant parts and parse the log’s timestamp.
filter {
     if [fields][source] == "wildfly" {
         grok {
             match => [
                 "message", "(?m)%{TIMESTAMP_ISO8601:[@metadata][timestamp]}\s+%{LOGLEVEL:level}\s+\[%{DATA:class}\]\s+\(%{DATA:thread}\)\s+%{GREEDYDATA:[@metadata]}"
             ]
         }
         date {
             match => ["[@metadata][timestamp]", "yyyy-MM-dd HH:mm:ss,SSS"]
             target => "@timestamp"
         }
         mutate {
             update => {
                 "message" => "%{[@metadata]}"
             }
             add_field => {
                 "[@metadata][target_index]" => "logstash-wildfly"
             }
         }
     }
 }
Logstash will forward the resulting document to the Elasticsearch cluster. SSL is — of course — enabled.
output {
     elasticsearch {
         ssl => true
         cacert => "/etc/logstash/ca.pem"
         user => "logstash_internal"
         password => "{{ logstash_users.logstash_internal }}"
         index => "%{[@metadata][target_index]}-%{+YYYY.MM.dd}"
         hosts => ["https://coord-1:9200"]
     }
 }
During my initial tests, I noticed that Logstash could not use the full capacity of the node with the default number of pipeline workers: 2. I amped up the number of workers to 8 which proved to be the ideal number for my setup.
#
# This defaults to the number of the host's CPU cores.
#
pipeline.workers: 8
Logstash will not persist any data to storage but will rely solely on its off-heap persistent queues. This implies that Logstash will consume more than the 1 GiB of memory allocated to the heap.
Fluentd
Fluentd will run on a node with the exact same specs as Logstash. I applied the OS optimizations proposed in the Fluentd documentation, though it will probably be of little effect on my scenario.
Fluentd will run with 4 worker threads. This proved sufficient.
<system>
  workers 4
</system>
The FluentBit agent forwards events to the forward input plugin. The setup is similar to that of the beats input plugin for Logstash. SSL and Mutual TSL Authentication are enforced.
<source>
@type forward
     bind 0.0.0.0
     port 24224
     <transport tls>
         cert_path /etc/td-agent/node-fullchain.pem
         private_key_path /etc/td-agent/node.key
         client_cert_auth true
         ca_path /etc/td-agent/ca.pem
     </transport>
 </source>
The filters in the pipeline are again similar to the Logstash setup. The filter splits each event into relevant fields. The timestamp will be extracted, but parsing it is the responsibility of the output plugin.
<filter wildfly>
@type parser
     key_name log
     reserve_data true
     <parse>
@type regexp
         expression /^(?<time>\d{4}-\d{2}-\d{2}\s+\d{2}:\d{2}:\d{2},\d{3})\s+(?<level>\w+)\s+\[(?<class>[^\]]+)\]\s+\((?<thread>[^)]+)\)\s+(?<message>.*)/m
     </parse>
 </filter>
<filter wildfly>
@type record_transformer
     remove_keys log
 </filter>
Fluentd forwards the documents created by the pipeline to Elasticsearch with the elasticsearch output plugin. The plugin also parses the timestamp and mimics some output behavior of Logstash (at least when configured as such).
<match wildfly>
     @type elasticsearch
     host coord-2
     port 9200
     scheme https
     user fluentd_internal
     password {{ fluentd_users.fluentd_internal }}
     ca_file /etc/td-agent/ca.pem

     logstash_format true
     logstash_prefix fluentd-wildfly
     time_key time
     time_key_format %Y-%m-%d %H:%M:%S,%L

     <buffer tag, time>
       timekey 20s
       timekey_wait 10s
       flush_thread_count 4
     </buffer>
 </match>
Documents are collected in chunks and forwarded in batches to Elasticsearch. I set up Fluentd to group chunks by time (required when adding a date to the end of the Elasticsearch index name). Each chunk is 20 seconds in size. Chunks are flushed to Elasticsearch when it reaches its maximum size or after a delay of 10 seconds (when the system time exceeds the chunks’ timeframe).
Simply put, anything that passes through the pipeline “should” end up in Elasticsearch after at most 30 seconds.
Fluentd will not persist buffered documents to store and only use the node’s memory.
Elasticsearch
I will not elaborate on the Elasticsearch cluster itself. It serves a purpose but is not the subject of this exercise. The most important property of the cluster’s setup is the fact that it is oversized for its purpose.
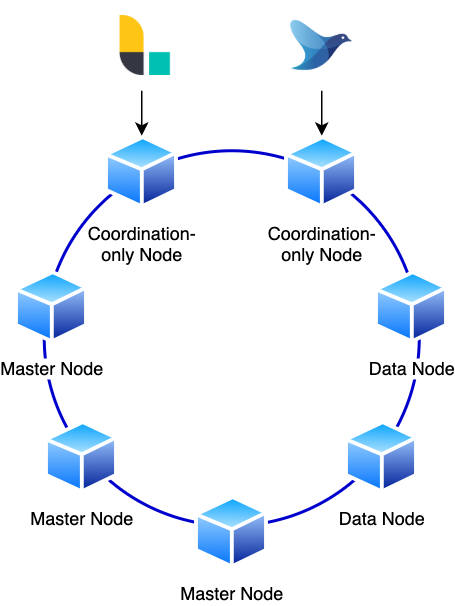
It features three master nodes, two powerful data nodes, and two coordination-only nodes. Each coordination-only node serves as a dedicated ingest point for Logstash and Fluentd.
Let her rip!
With the testbed and all tools set up, it’s time to throw some actual load at it. All 10 workload nodes will generate load at the same time. The number of threads are ramped up every three minutes, with increasingly large steps.
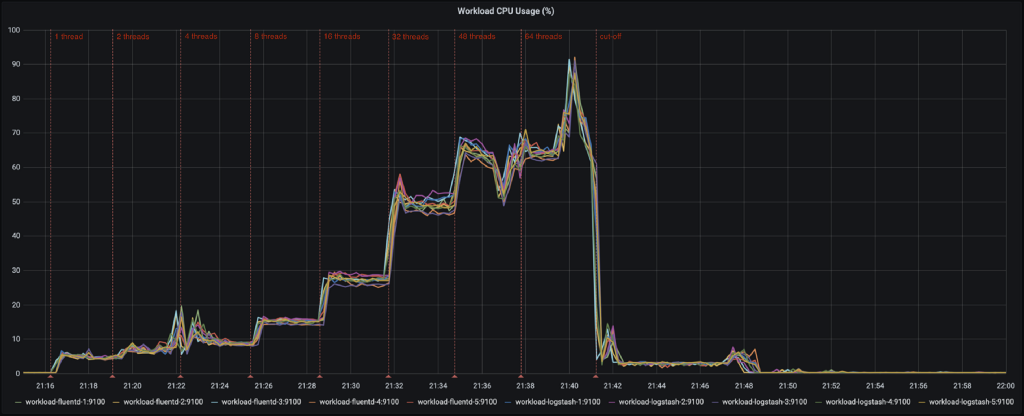
At lower volumes, both Logstash and Fluentd are showing a comparable load on the system. This behavior changes at the point 16 threads / workload nodes and it clearly shows that Logstash requires more CPU to process a comparable volume of events. On average, CPU load is 25% higher.
At 32 threads, Logstash reaches a maximum, while Fluentd still has some leeway. Fluentd reaches its maximum at 48 threads.
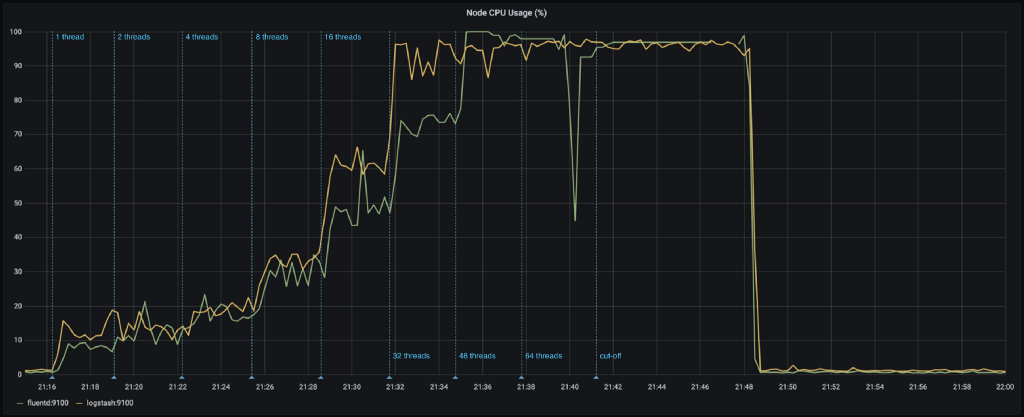
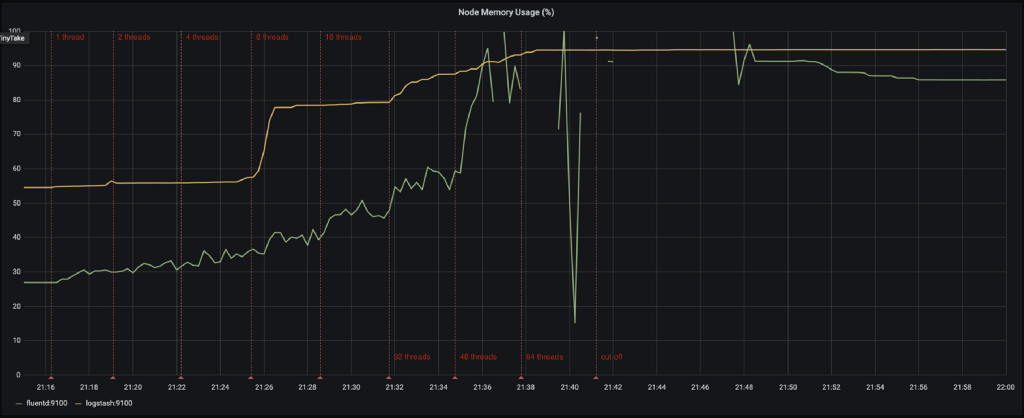
The evolution of nodes’ memory also shows some interesting facts:
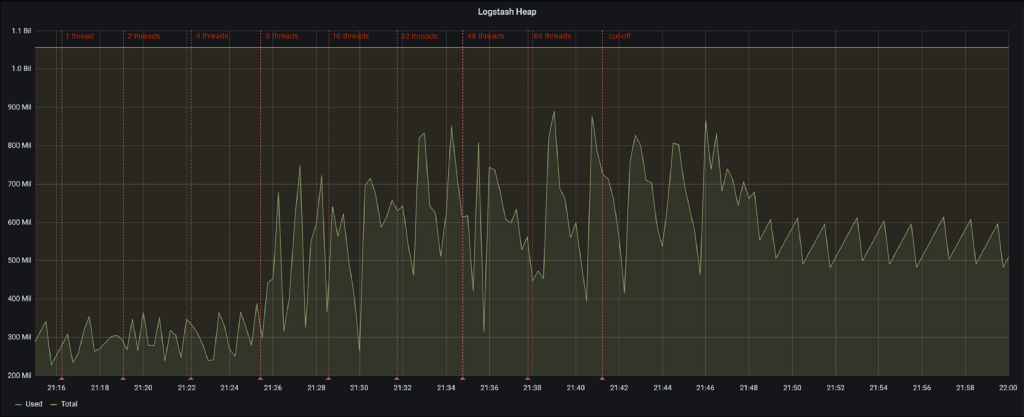
- Logstash uses more memory from the start, due to the fixed heap size. The JVMs metrics for the heap show no real shocking behavior.
- At 8 threads, Logstash’s memory consumption jumps up. It would seem that at this point, the multiple pipeline workers reserve their fair share of off-heap memory for the persistent queues.
- At 32 threads, Logstash gradually starts consuming more memory and cannot keep up with the influx of events. The system however does not run out of memory and memory consumption flattens out at a certain point. Most likely, at that point, FileBeat cannot push more events towards Logstash.
- Fluentd gradually consumes more memory as the load increases. This dramatically changes at 48 threads where Fluentd reaches maximum CPU usage. Memory consumption surges up and the system runs out of memory. From that point on, the Fluentd node acts erratically. Events are being dropped (seen in the logs of FluentBit) and even some metrics can no longer be collected properly.
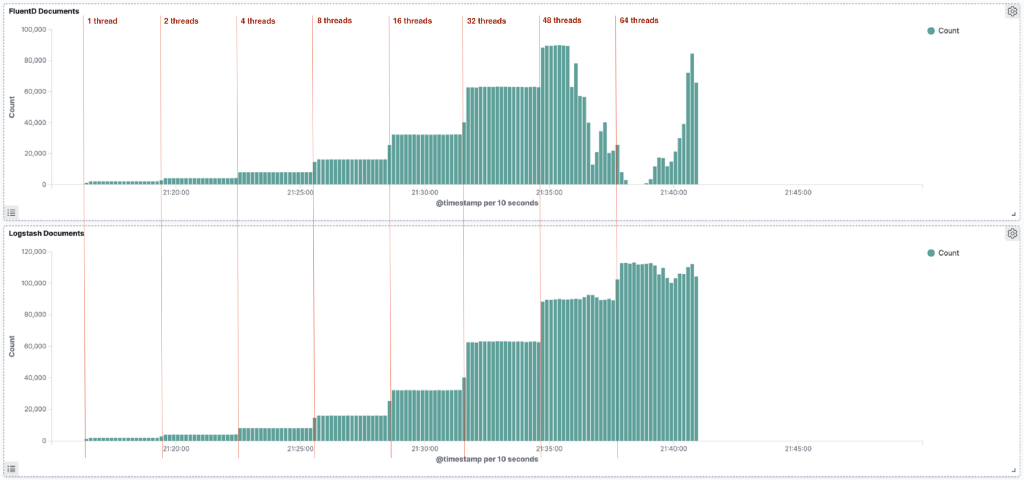
- The effect of running out of memory clearly shows in the number of ingested documents in Elasticsearch. Where we first saw a clean staircase pattern, there is now a sizeable amount of documents missing shortly after the number of threads was raised to 48.Logstash was able to process its backlog of events right until the highest volumes. At that point, there seems to be a slight drop off.
Any Conclusions?
Hard to say. Both Logstash and Fluentd are highly configurable applications. I am sure there are a lot of parameters that can be tweaked to yield different results. Who knows? Maybe I may just do that someday.Fluentd requires fewer resources but doesn’t look that good when it runs out of resources. If this test shows anything, then it’s that it’s probably a bad idea to rely on in-memory persistent queues without some kind of buffering mechanism in front of the log aggregator.In any case, if you want to know more about log aggregation or our DevOps services, don’t hesitate and get in touch with the experts at FlowFactor.

Sorry, the comment form is closed at this time.